




Product Analytics Pipeline & Dashboard
Overview
Self-serve customer data for business teams, without touching the production database.
The problem
Whenever the customer success or business development teams needed data, usage trends, billing/spend on an account, flight counts over the last week or month, or signals on why a customer might be churning, they had to go to a developer, who would run one-off scripts against the production MongoDB to pull it. With developers busy on their own work, requests that needed a same-day answer for an urgent customer conversation could sit for two days or more, and this inconsistent, manual process dragged on for months.
What I built
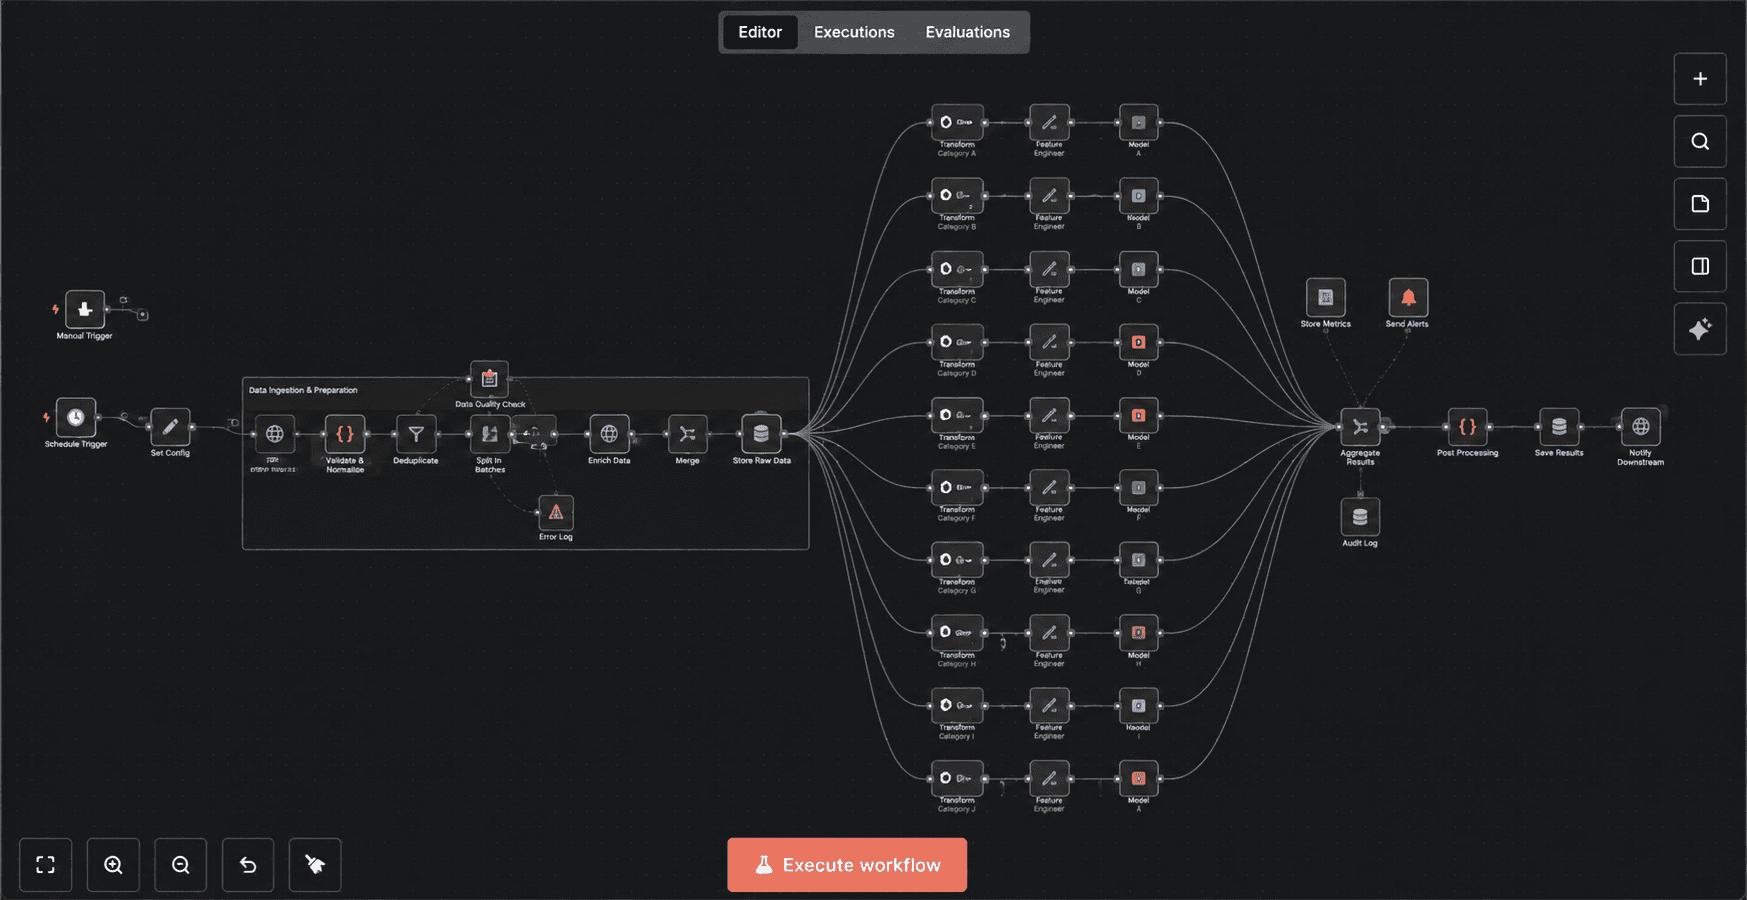
A product analytics dashboard that gives business teams self-serve access to this data without ever querying production directly, since running ad hoc queries against a database with millions of records risked degrading or crashing it. I built an ETL pipeline using Fivetran connectors to continuously replicate the relevant MongoDB collections, converting BSON documents into proper relational tables, into Supabase. On top of that, I created materialized views and analytical views (lean virtual tables exposing only the columns each query needs) along with RPC functions secured by row-level security policies, which brought query times for millions of records down to 2-3 seconds. The dashboard itself lets teams drill into a specific organization's data, view usage across the US and Europe regions, filter by date range (last 30 days, last 40 days, etc.), rank top organizations (top 20, top 25) by usage, and configure alerts through an MCP-based interface.
Impact
Removed developers as the bottleneck for every data request and replaced a multi-day, inconsistent, script-by-hand process with a self-serve dashboard, while keeping the production database completely insulated from the query load. With direct visibility into usage and alerts flagging accounts that needed attention, business and customer success teams could reach out to at-risk customers before they churned instead of after, and the underlying analytics gave them a basis to decide where to focus expansion, by region and by industry, instead of guessing.